Which Russell Westbrook are we going to get this season? Bestbrook? Westbroke? A regular ol’ Westbrook? Well, last season we saw a season for the ages. Westbrook was just 0.3 percentage points off Kobe Bryant‘s 2005-06 record for usage rate in a season. Westy also had 4.1 more dimes per game, 2.0 more boards and more steals while playing 6.6 fewer minutes per game and leading the NBA in scoring. He epitomized the term stat factory.
Before we get to Westbrook, allow me to address my favorite stat. Usage rate can go a long way in daily fantasy sports (DFS) and it’s even a factor in season-long leagues. Usually, the high-usage, high-minute guys are going to be your expensive players in DFS and guys with a sudden boost in usage can be a bargain. If you can identify frequently-used players in advantageous positions, you’re going to win a lot of money.
We’ll be spending the next month identifying which players are going to be the main stories to watch for usage. We’ll also look at some scoring trends, shot types, pace, and really everything else factored into a players points per game. On top of the scoring, we’ll add some rebound-rate stats and other rates to help spot the non-scoring studs in fantasy this season.
In case you missed the entire series last year and aren’t familiar with that stat, it’s basically the percentage a player ends his teams possessions. A quick, simple example: Player A has three field goal attempts and one turnover in his team’s 10 possessions, he has a 40 percent usage rate. Easy, right?
Follow me on Twitter @MikeSGallagher for all sorts of stats, analysis, Vines and more.
Let’s take a look at the king of usage rate these days:
Russell Westbrook has led the NBA in usage rate in each of the last two seasons and he’s been in the top two for four seasons. He is also third among qualifiers for assist percentage and he was first for point guards in total rebounding rate last season. Yes, this is why Westy was the most expensive player on a DFS slate towards the end of the season last year.
Well, Kevin Durant is back and Westy tends to be less productive, which is highlighted by his usage rate. When Westy was with KD, he only had a 32.5 usage rate in 718 minutes — yes, only 32.5. That is right in the neighborhood of his 33.3 usage rate in 2013-14, which again led the league.
Now without KD, Westy was absurd. He posted a 42.2 usage rate in his 1,583 minutes without him last season. Westbrook also put up a 38.4 usage rate in the final 27 games without KD, running at a 101.8 pace in his 36.7 minutes per game, and was able to put up a respectable 53.4 true shooting percentage. What did that translate to on the stat sheet? In those 27 games, he averaged 31.3 points, 8.7 boards, 9.9 assists, 2.0 steals and 1.7 treys with 5.2 turnovers per game. That’s insane.
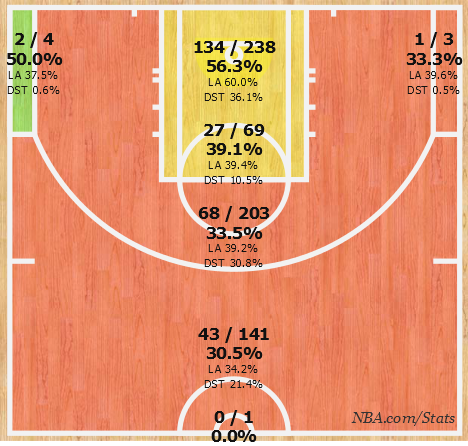
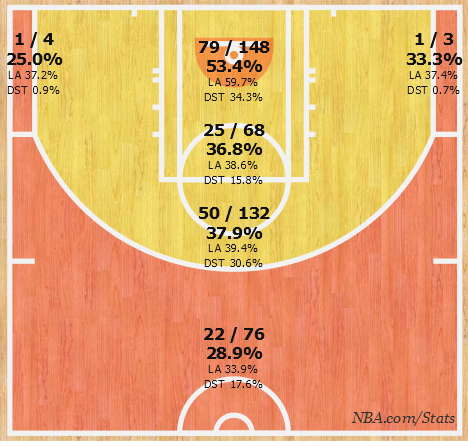
So most of you guys probably know about the higher usage, but what about how he used that usage sans KD? Let’s examine how he got his shots with and without him. Here are his shot charts in those final 27 games (top) compared to Westbrook performed in his 22 games while KD was on the court before his season-ending injury:


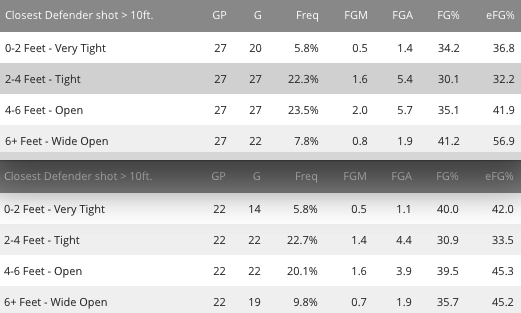
It’s so odd. Westbrook was better at the rim without KD and better from 3-point range.The big difference was how awful Westbrook was in the mid-range game, but we all know Westy gets ripped by everyone on those shots, and hopefully no more Scotty Brooks cuts that down anyway. As you could expect, he was contested quite a bit on shots from beyond 10 feet. Here’s a comparison from the same timeframe.

Somewhat surprisingly, Westbrook was open and wide open (combined) on more shots in the KD-less stretch. He was also less efficient on his open shots, too. Feel free to blame that on former coach Scott Brooks or Westy himself for believing in Pastor Pipe’s “I’d rather take a contested shot than an open shot any day” religion. Well, if you do blame it on Brooks, there’s good news because OKC hiring Billy Donovan to take over. What does that mean for Westy’s play types? Let’s look at last season.
When you think of Westbrook’s game, you automatically think about his transition game. He was by far the leader in possessions in transition last year and needed just 67 games to do it. In fact, his 8.1 transition possessions per game is 45 percent greater than James Harden‘s second-ranked 5.6. On the other hand, it turns out Westy wasn’t very efficient on those, coming in at just 46.7 percentile. Donovan shouldn’t try to reinvent the wheel here and should let Westbrook do his thing in the open floor. We’ll have more on Donovan’s system a little later.
Those transition possessions were just 26.6 percent of his plays last year, so where else was he a factor and can he improve? His biggest play by far was pick-and-roll, and he was actually very good at it as a scorer. He ran PNR for 33.8 percent of his possessions and came in at 61.7 percentile. That’s not spectacular or anything and there could even be some improvement this year with Enes Kanter, Serge Ibaka becoming a better offensive guy, or maybe Donovan used KD more as a roll man, which would be amazing. In fact, KD came in at 100 percentile as a roll-man scorer on PNR, but he was only used about once per game — 4.1 percent of his possessions. Interestingly, Serge Ibaka was not a great roll man at just 34.8 percentile and maybe the coaching change helps him — I’d venture a guess that the coaching change helps him more than anyone. By the way, Enes Kanter was very good as a roll man with OKC at 75.6 percentile, which is up from 19.9 with Utah. Suck on that, Westy-is-not-a-point-guard haters.
The first thing we all think of with the Brooks offense is isolation. As much as we all think about it with such a negative mindset, Brooks is just playing the hand he’s dealt. KD is arguably the best isolation player in the past two decades, so it’s not really a bad play for him. For Westbrook, it’s not quite so rosy. He came in at 62.3 percentile on those, which accounted for 12.6 percent — that’s hardly a big number and 49 other players had a greater percentage last year (minimum of 10 possessions of isolation). Westbrook is starting to figure out where he thrives in offensive plays and his isolation distribution could be closer to 10 percent.
Besides those, we didn’t see much else from Westy. He had just 6.7 percent of his plays come in spot-up (47.7 percentile), 5.2 percent in post-up (58.4 percentile), 4.9 percent on hand offs (63.7 percentile), 3.0 percent on putbacks (18.6 percentile), 1.8 percent off cuts (71.8 percentile) and 0.9 percent off screens (41.1 percentile). None of those are eye-popping and feel free to chalk it up to the uninventiveness of Brooks.
Perhaps the biggest change coming could be the off screen. The Warriors changed the game and scored 743 points off screens last year, which was 22.8 percent greater than any other team. If I’m a new coach, I’d want to at least try to integrate some successful aspects of today’s best teams. Westy takes a ton of contested 3-pointers, so maybe getting him off the ball for some looks can help him get at least close to 35 percent — he was at just 29.9 percent last year. Overall, we really saw Westbrook’s efficiency drop from last year, too. As you can see on the shot chart, he’s just not great above the break on 3-pointers. Westbrook has actually seen his 3-point percentage drop in each of the last three seasons.
Hey, so speaking of Donovan, what can we learn about what the Gators did last year? Well, they didn’t run too much and ranked 139th out of 351 in percentage of points scored in transition. Coincidentally, they ranked 139th in percentage of shots at the rim, they were 280th in percentage of points scored on two-point jumpers, 68th in percentage of points scored on 3-pointers, and 322nd on percentage of 3-pointers coming off an assist. Coach Donovan has typically been a defense-first guy, so that may explain why his Gators ranked 289th in pace. All that said, there really isn’t a glaring negative or positive here. The biggest point looks like the 3-point shot, so we could see OKC launch more. More threes for KD? Yes please.
This is obviously a ton of data, so what does it all mean? Assuming KD is BACK, we can certainly expect Westy to take regress a bit. Two seasons ago, he was a shade below 22 points per game, so we can probably split the difference on points to put him at around 25 this season.
He’s likely going to keep dropping dimes. Westy obliterated his career high for assist percentage and he just missed his career low on turnover percentages, too. That may come as a surprise because nobody turned the ball over more than Westbrook last year. He should probably be more of a 7.6 dime, 3.6 turnover guy this year.
Speaking of turnovers, it’s a little interesting to see how Westy turned it over last year. Of his 293 turnovers, 57.0 percent were due to bad passes, which is just above his 56.5 percent from 2013-14. His lost-ball turnovers were at 27.3 percent, which is way up from his 23.2 percent in 2013-14. Obviously all that usage and resulted in the loose ball turnovers to get him to his league-high 4.4 per game. That should come back down and he may have a chance to see it drop below 3.5 per game — he’s been at 3.3 or greater in every year since 2010-11.
Thanks for reading! Shoutouts to Synergy, NBA.com, NBAWowy and Basketball Reference for these stats.
This entry passed through the Full-Text RSS service – if this is your content and you’re reading it on someone else’s site, please read the FAQ at fivefilters.org/content-only/faq.php#publishers.